Det viser e_calvin_beisner her + video med Tony Heller
Taget herfra
How NOAA Climate Catastrophists Mislead
By now practically everyone who follows news and commentary about climate change has seen graphs of global warming over the past century or more. The National Oceanic and Atmospheric Administration (NOAA) produced this one in 2017, covering 1880–2016.

Ever since it first appeared, it has been one of the most commonly used, whether in scholarly journals or government websites or news media or blogs or social media. More recent data generally are communicated similarly — and it’s not hard to understand why.
Here, solid bars, one for each year, depict the change in global average temperature (depicted as anomalies, i.e., departures, from the 20th-century average), and the psychological impact is predictable: fear.
How? Bars in the early years, below the average, are a comforting blue; later bars, above average, are an alarming red. If all the bars were the same color, the psychological impact of the different colors would be lost.
But the color choices aren’t all. They’re just the most obvious. Another choice is less obvious, and readers unfamiliar with how to interpret graphic representations (or misrepresentations) of data are likely not to notice it.
Ominously, the longest blue bars reach almost to the bottom of the graph, and the longest red ones almost to the top. Why? Because the vertical axis chosen (and note that word — it’s a definite choice) covers only from -0.5°C to +1.0°C (-0.9°F to +1.8°F). A grand total of 1.5°C (2.7°F).
On the one hand, this is quite defensible. Enter the raw numbers into common spreadsheet software, tell it to produce a bar graph, and that, or something very close to it, is what you’ll get. And why not? After all, it accommodates all the numbers, lowest to highest. What more can we ask?
On the other hand — if your intent is to help people think reasonably about changing global temperature, it’s utterly indefensible.
Why? Because it makes a temperature variation of under 1.5°C (2.7°F) look, to the unpracticed eye, far more significant than it is. After all, most people hardly notice if a room’s temperature rises or falls that much. But on this vertical scale, the longest red bars reach almost to the top, as if to say, “We’re about to reach the maximum!” True, the longest blue bars also reach almost to the bottom, which could be interpreted, “Whew! We just barely missed freezing!” (And since cold snaps kill, on average, 10 to 20 times as many people per day as heat waves, that should be really comforting — but I digress.)
But remember, blue’s a comforting color; red routinely means “danger!” That, after all, is why United Nations Secretary-General António Guterrez called the first volume of the Intergovernmental Panel on Climate Change’s Sixth Assessment Report “code red for humanity,” not “code blue” (though, admittedly, in a hospital “code blue” denotes a critical status of a patient — but that’s not common lingo).
And since most people read from left to right, the graph subtly communicates that, whatever risks might have come with those low temperatures, we’ve left them far behind. No need to worry about them now. It’s those high temperatures, marching inexorably upward, that we need to worry about.
Back in the early 1990s, when I was managing editor of the book The State of Humanity, its general editor, the late economist and statistician Julian L. Simon, legendary for his antipathy to misleading statistical graphs, insisted that all graphs of the data provided by the 58 authors (including eight Nobel Prize winners) use a realistic, objective scale.
For example, graphs of data expressed as percent should have a vertical scale of a full 100 points — otherwise, the result could be highly deceptive. After all, if the vertical scale only went from 80% to 90%, a data point of 86% could appear to depict a quantity twice as high as 83%, when in reality it’s only 3.6% higher.
Another example: Graphs of data that don’t depict percents should have a zero baseline. Or, if they depict both negative and positive data, the vertical axis should stretch equally far below and above zero, so the relative magnitudes would be quickly and easily comprehensible. Or, if they depict data so enormously different that low numbers just disappear, they should be drawn with exponential scales — and that fact should be communicated prominently — or with clearly marked discontinuities along the vertical axis.
There are other examples, but you get the point. One of the basic principles is that the vertical axis should cover a truly significant range.
That’s the bigger problem with NOAA’s famous graph. As we saw above, it makes a very small change in temperature appear much larger and more significant.
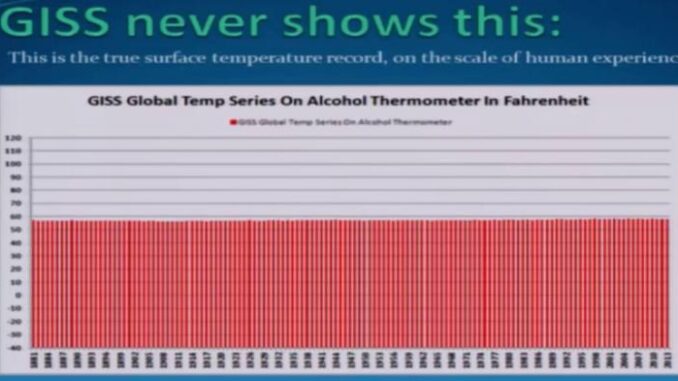
A more appropriate, less misleading, way to graph the same temperature data is to use a vertical range that’s fairly typical of the weather people commonly experience. That’s a scale they’ll understand.
In the United States, except when air currents rapidly move a much warmer (or cooler) air mass from one locale to another, diurnal (daytime high to nighttime low) temperature range is typically around 5.6°C (10°F) in humid locales but around 22.2°C to 27.8°C (40°F to 50°F) in arid to semi-arid locales. In other words, people are accustomed to those temperature ranges.
It would seem reasonable, then, to depict global temperature anomaly data on a vertical scale of, say, halfway between the low and high ranges, i.e., 16.7°C (30°F). And, to complete our avoidance of psychological scare tactics, we’ll jettison the color scheme and use a neutral color.
How would NOAA’s data for 1880 to 2016 look depicted that way? Like this:

Remember, this depicts exactly the same data depicted in NOAA’s graph. Does it look scary? No, but it’s a much more honest, objective, non-manipulative depiction of the data. So, now you’re equipped not to be manipulated — and to enlighten your friends and neighbors.
Defenders of the scary way to depict the data could respond, “But the fact is that this apparently slight change in global average temperature will, if it continues at scale, cause devastating changes in weather, sea level, crop production, and other measures — changes that will impoverish humanity and possibly even bring about its extinction. So scary depiction of scary facts is just what we need.”
But the Intergovernmental Panel on Climate Change disagrees — firmly and adamantly. Its 2018 Special Report on Global Warming of 1.8°C concludes that if we do nothing to slow greenhouse gas-induced warming, the warming will make gross world product (GWP) in 2100 2.6 percent lower it otherwise would be.
What would it otherwise be? The Center for Global Development says economic growth through the remainder of this century is most likely to be about 3 percent per year. After factoring in change in population, the result would be GWP per capita 8.8 times what it was in 2018.
When poverty is a far greater threat to human health and life than anything related to climate and weather, can anyone think that’s a catastrophic result?
If you spend much time at all on social media sites on which people often post text or pictures meant to make points about controversial issues, you’re bound to have seen “fact checks” stating that a post conveyed “false or misleading information” because it was “missing context.” (That’s a judgment that’s often subjective and driven by the “fact checker’s” ideology, but we can ignore that for now). What you now know is that, when it comes to “missing context” about climate change, official government agencies can be among the worst offenders, not just on social media but also on agency websites — from which their products, like the NOAA graph evaluated here, regularly make their way into scientific journals and mainstream media.
A Google image search July 11, 2024, found NOAA’s graph at about 100 sites. Where are those “fact checkers” when we need them?
E. Calvin Beisner, Ph.D., is President of The Cornwall Alliance for the Stewardship of Creation, a Christian think tank addressing environmental stewardship and economic development for the poor. He is also co-editor, with David R. Legates, Ph.D., of Climate and Energy: The Case for Realism, an Amazon bestseller.
Taget herfra
Tony Heller har mange gange vist at NOAA manipulerer data, ikke kun med forkert skala, som ovenfor, men direkte med at ændre i de registrerede data !
For alle NOAA/fake-news-msms grafer er ALTID med “anomaly” som Y-akse , ALDRIG med målte temperaturer, for så kan enhver se deres klima-FUP
Se f.eks. denne her

Her viser Tony Heller at al ævlet om “den varmeste dag målt” også er manipuleret !
Jeg har lagt mærke ligt af censurSVINENE på youtube ikke viser nye videoer af Tony Heller, SELVOM man abonnerer : sandheden er ilde hørt
Leave a Reply